Yes, you can use Tableau for project management, primarily for visualizing project data, tracking progress, and identifying potential issues, although it’s not a dedicated project management tool.
Wondering, can I use Tableau for project management? You might be surprised to learn that while it isn’t a full-fledged project management system, Tableau provides powerful ways to visualize project data. Think about creating dashboards to monitor milestones or resource allocation; this is where Tableau really shines.
Visualizations can help you to quickly grasp project status and spot any trends. Tableau can help you identify bottlenecks and improve decision-making process. You can track timelines and see if everything is going to finish on the schedule.

Can I Use Tableau for Project Management?
So, you’re wondering if Tableau, that cool software for making charts and graphs, can actually help you manage your projects? That’s a smart question! Most people think of Tableau for looking at sales numbers or website traffic, but it’s got more potential than that. The short answer is: yes, you can use Tableau for project management, but it’s not a project management tool in the traditional sense. Think of it more like a super-powered reporting and tracking sidekick.
Tableau’s Strengths in Project Context
Let’s explore how Tableau shines when applied to projects. Instead of managing the day-to-day tasks, it lets you get a bird’s-eye view of what’s happening. Here are some of its key advantages:
- Visualizing Project Data: Tableau’s real superpower is making data easy to understand. Imagine looking at a complex spreadsheet with hundreds of rows. It can be overwhelming! Tableau takes that same data and turns it into colorful charts, graphs, and dashboards that quickly show you important patterns and trends. You can spot delays, budget issues, and resource problems much faster.
- Real-Time Progress Tracking: Forget stale reports. Tableau connects to your project data sources (like spreadsheets or databases) and shows you the latest information. This means you can see how your project is doing right now, not just how it was doing last week. You get an up-to-the-minute view of how your project is moving forward.
- Identifying Bottlenecks and Risks: Using Tableau, you can spot problems early. For instance, if one task is taking way longer than expected, you’ll see it instantly in a visualization. This lets you take action before a small delay turns into a big headache. You can see which areas are going well, and which areas need extra attention.
- Communicating Progress to Stakeholders: When you need to tell others about your project’s status, Tableau makes it easy. The charts and dashboards are easy for anyone to understand, even if they don’t work on the project every day. This creates transparency and better communication with team members, clients, and bosses.
What Tableau Can Show You: Specific Project Metrics
Okay, let’s get into the nitty-gritty of project metrics. Tableau can handle a variety of project-related data, presenting them in ways that are insightful and actionable. Here are some examples of what you might track:
Key Project Data Points
- Task Status: See which tasks are completed, in progress, or blocked. You can use colors to quickly identify which tasks need urgent attention. You might use a green circle for completed, a yellow triangle for in progress, and a red square for blocked, allowing you to get a clear view of overall progress.
- Budget vs Actual Spend: Track how much money you’ve spent compared to your planned budget. Visualizations can highlight overspending areas to make sure project costs stay controlled. A bar chart can be used to see if a project is trending towards overspending.
- Resource Allocation: Check how your team members are assigned to different tasks. See if anyone is overloaded or if there are unused resources. A stacked bar chart can illustrate who’s working on what project components.
- Timeline Adherence: See if your project is on schedule or behind. A Gantt chart in Tableau, which it can create, can show a clear visual representation of the project timeline. You can easily see where your project is on track and where it is falling behind.
- Risk Tracking: Monitor potential risks to the project. You can even link risks to specific tasks to help you understand the potential impact. If a task is at a high risk level, this can be flagged for quicker intervention.
- Key Performance Indicators (KPIs): Track your most important project success measurements, like completion rate, cost variance, or customer satisfaction. A speedometer-style chart can show progress towards the KPI targets.
Think of these as puzzle pieces, when put together they can provide a complete overview of your project’s health. Tableau gives you the power to assemble these pieces in meaningful, easily understandable ways.
How to Use Tableau Effectively for Project Reporting
To use Tableau for your project effectively, you’ll need to be thoughtful about how you structure and connect your data. Let’s go through the steps:
Data Preparation and Connection
- Gather Your Data: The first step is to make sure you have all the project data you need. This might be in different places like spreadsheets, databases, or even project management tools. Tableau works with various data sources, so having data in different formats usually isn’t a problem.
- Clean and Structure: Make sure your data is clean. Get rid of errors, empty cells and inconsistent information. You may need to create columns like ‘task start date’, ‘task end date’, ‘task owner’ etc. Tableau works best when the data is structured properly. Each data column needs a clear heading.
- Connect to Tableau: Import or connect your data to Tableau. You can connect to Excel files, CSV files, databases and many other types of data sources. Select the data source and import it to your workbook.
Building Project Visualizations
- Choose the Right Charts: Choose the best type of chart or graph for the data you want to show. Bar charts are good for comparing values, line charts are good for seeing trends over time, and pie charts are good for showing proportions. A Gantt chart is especially helpful for displaying project timelines.
- Create Dashboards: A dashboard lets you put multiple charts and graphs onto a single page. Organize them in a way that makes sense for your project. Think of the dashboard as your central view of the project progress. You can add filters to interactively change your view as you wish.
- Use Color Effectively: Colors can help you understand information quickly. For example, use red for problem areas, green for things on track, and yellow for caution areas. Be consistent with your color coding to avoid confusion.
- Add Filters and Interactivity: Allow users to filter the data. For example, you can filter by task owner or project phase. This will make it easier to analyze specific aspects of the project. Tableau allows you to make your dashboards interactive.
Best Practices for Tableau Project Reports
- Keep It Simple: Don’t overcomplicate your dashboards. Focus on the most important project information. It’s better to have a few clear charts than many confusing ones.
- Regular Updates: Update your dashboards frequently with the latest data. This makes your project tracking accurate and reliable. Automatic refreshes can help with this, so your reports are always up-to-date.
- Share Your Work: Make your Tableau dashboards accessible to the people who need to see them. Share them through the Tableau server or by exporting them as PDF documents. Sharing helps improve communication and transparency within the team.
- Gather Feedback: Ask for feedback on your Tableau dashboards. Other people may have useful ideas on how to make them even better.
Limitations of Using Tableau for Project Management
While Tableau is great for reporting and visualization, it has its limits. It is crucial to understand that it is not a full-fledged project management system. Here are some important points to keep in mind:
What Tableau Doesn’t Do
- Task Management: You cannot directly assign tasks, track to-dos, or manage workflow in Tableau. It cannot manage deadlines, send reminders or assign team members. For that, you’ll need a project management tool, like Asana, Trello or Jira.
- Communication: Tableau doesn’t provide the means for project team communication. You can’t use it to send messages, leave comments or create project updates. You need to use other platforms for team collaboration.
- Resource Scheduling: Tableau does not offer specific features for managing and scheduling resources. It doesn’t automatically handle booking time, allocating resources or managing calendars.
- Document Management: You can’t store or share project documents directly within Tableau. You’ll need another system for keeping important documents organized.
The Need for Complementary Tools
Because Tableau lacks these features, it’s best used alongside a project management tool. Think of your project management software as the place where you plan, collaborate, and manage tasks. And then use Tableau to pull the data from this tool and see the bigger picture. Your project manager tool is where the work is managed and done, while Tableau is used to track, analyze and display progress in an easy to digest way.
Who Benefits Most from Using Tableau in Project Management?
While anyone can try using Tableau for project analysis, certain roles find it exceptionally beneficial. These include:
Beneficial Roles
- Project Managers: Tableau can significantly reduce the time project managers spend compiling reports. It also offers a more dynamic understanding of the project’s health. They can easily identify the problems areas and allocate necessary resources.
- Project Team Members: Team members benefit from the clear visual updates that Tableau provides, allowing them to track their contributions and understand the overall project status. It can boost transparency and accountability within the team.
- Stakeholders: The easy-to-understand dashboards are great for keeping clients, upper management, and other stakeholders informed about the project’s progress and its alignment with the project’s goals. It allows them to quickly understand where projects stand.
- Portfolio Managers: Those who manage multiple projects can use Tableau to get a single overview of their entire portfolio, quickly seeing which projects need attention and which are on track. Portfolio managers can identify cross-project risks and make informed strategic decisions.
Tableau vs. Dedicated Project Management Software
It’s essential to compare Tableau to a dedicated project management tool. Both have their own strengths, and understanding the differences will help you choose the right tool or combination of tools for the best project management strategy.
Tableau
- Focus: Data visualization, reporting, and analysis.
- Strengths: Excellent for creating interactive dashboards and visualizing progress. Good for identifying trends and tracking key metrics.
- Weaknesses: Limited task management, communication, and resource planning features.
Project Management Software (like Asana, Trello, or Jira)
- Focus: Task management, team collaboration, and project planning.
- Strengths: Features for assigning tasks, tracking progress, setting deadlines, and communication. Includes features for managing timelines and resources.
- Weaknesses: May lack the extensive data visualization capabilities offered by Tableau. Often has limited reporting capabilities or require paid add-ons.
The Verdict: Use Tableau in addition to your project management software. Not as a replacement to it. Project management tools manage the work, and Tableau shows you where you are, what’s going well, and what needs attention.
Example Scenario: Using Tableau for a Marketing Campaign
Let’s imagine that you are running a marketing campaign and want to use Tableau. Here’s how you could use it:
- Data Collection: Collect data from multiple sources like Google Analytics, social media platforms and marketing spend tools. Clean and combine the data.
- Visualization: In Tableau, build visuals to show campaign performance. Track the leads generated, website traffic, social media engagement, ad spend, conversions and so on. You will see which campaigns are working well and which are not giving results.
- Dashboards: Create dashboards to see an overview of the entire marketing campaign. You can show charts for campaign performance, budget spending and overall return on investment. It will help you to understand the key metrics.
- Insights and Actions: Using the Tableau reports you can quickly identify the trends and patterns. You can see if the campaigns are going as planned. Use the insights from the reports to decide on the marketing budget or make changes to the campaign plan.
In this scenario, Tableau helps to see the bigger picture of the marketing campaign and provides insights to make strategic decisions.
In summary, while Tableau isn’t designed as a traditional project management tool, it is a strong reporting and data analysis tool. It can help make sense of complex project data, identify issues and keep all stakeholders well informed. When you use it alongside a project management system, it can be a great asset to take your projects to the next level.
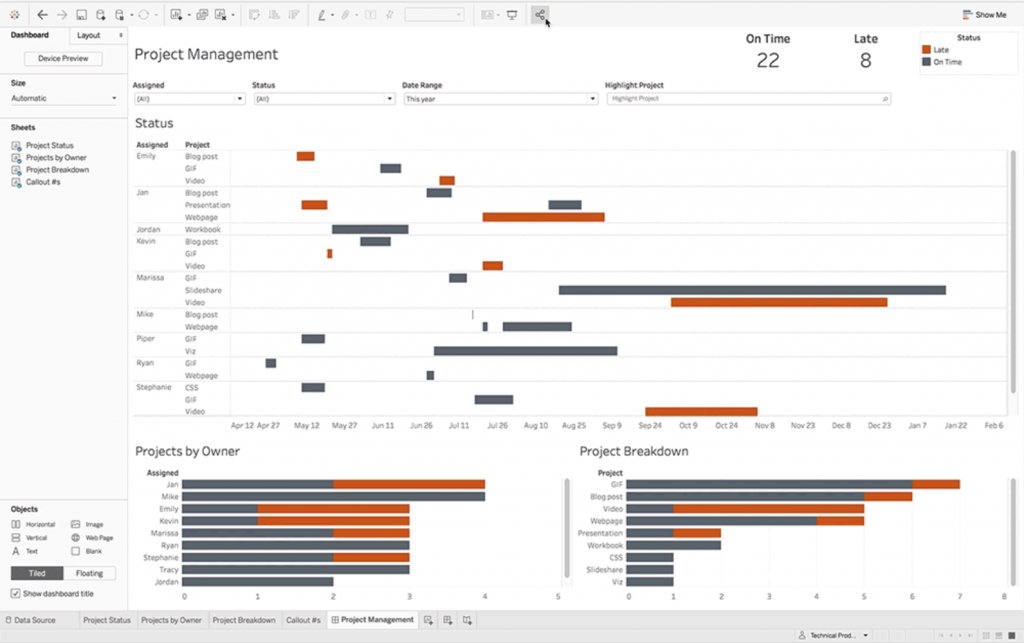
Simple Project Management Dashboard Using Tableau
Final Thoughts
Tableau primarily functions as a data visualization tool, ideal for monitoring progress and identifying trends. Project managers can use Tableau to create insightful dashboards showing task statuses, resource allocation, and budget tracking. These visual aids improve communication among team members and stakeholders.
However, Tableau lacks essential features for comprehensive project management like task assignment and scheduling. Therefore, while beneficial for visualizing project data, the answer to the question, ‘can i use tableau for project management’ is that it’s best utilized in conjunction with a dedicated project management software, for a complete solution.